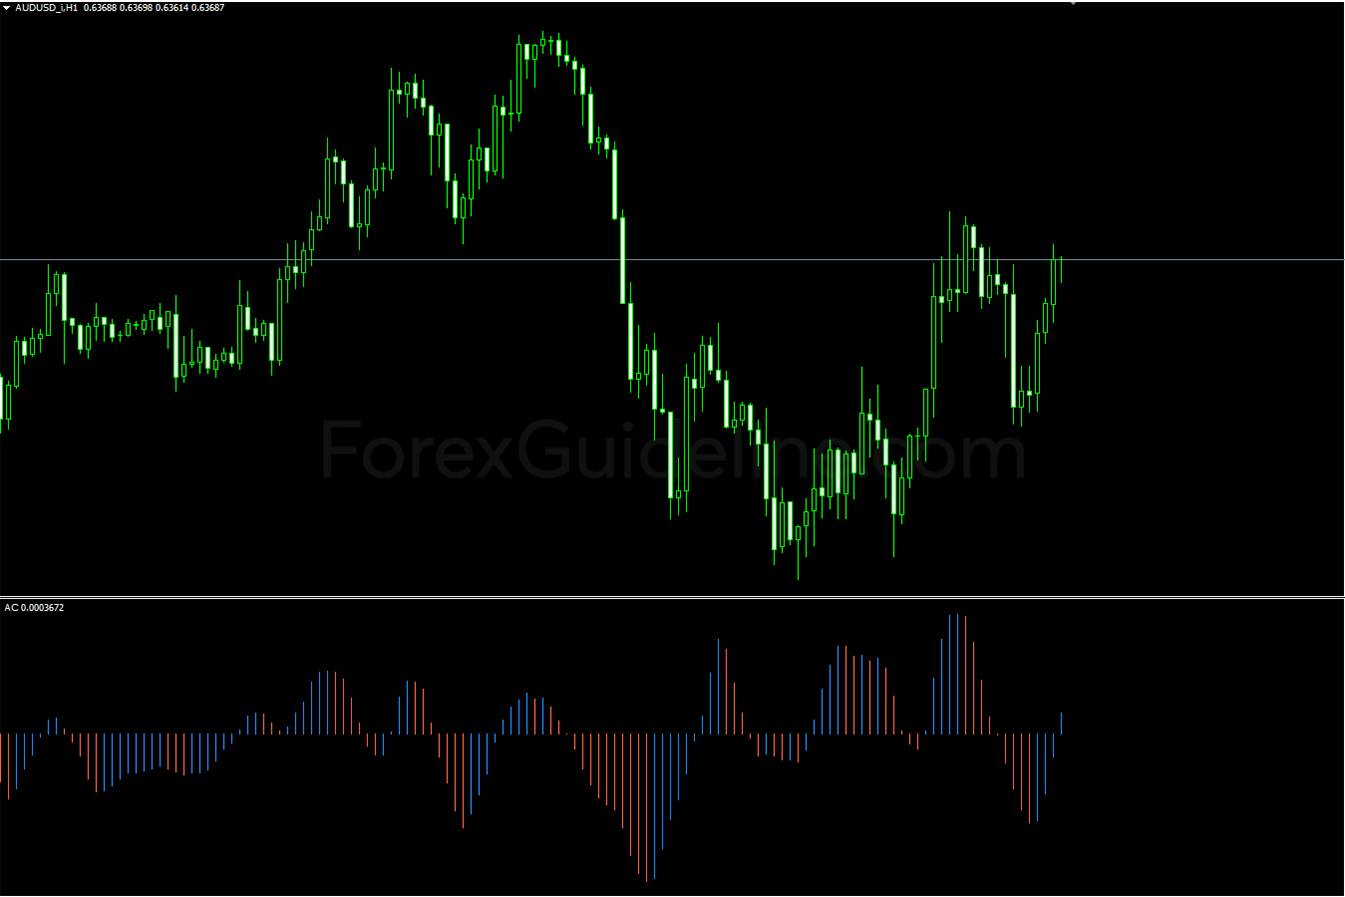
The Accelerator/Decelerator indicator is an oscillator uses to identify the basis of price action. The price action of a currency pair results from … Read More»
Accumulation/Distribution (AD) Indicator
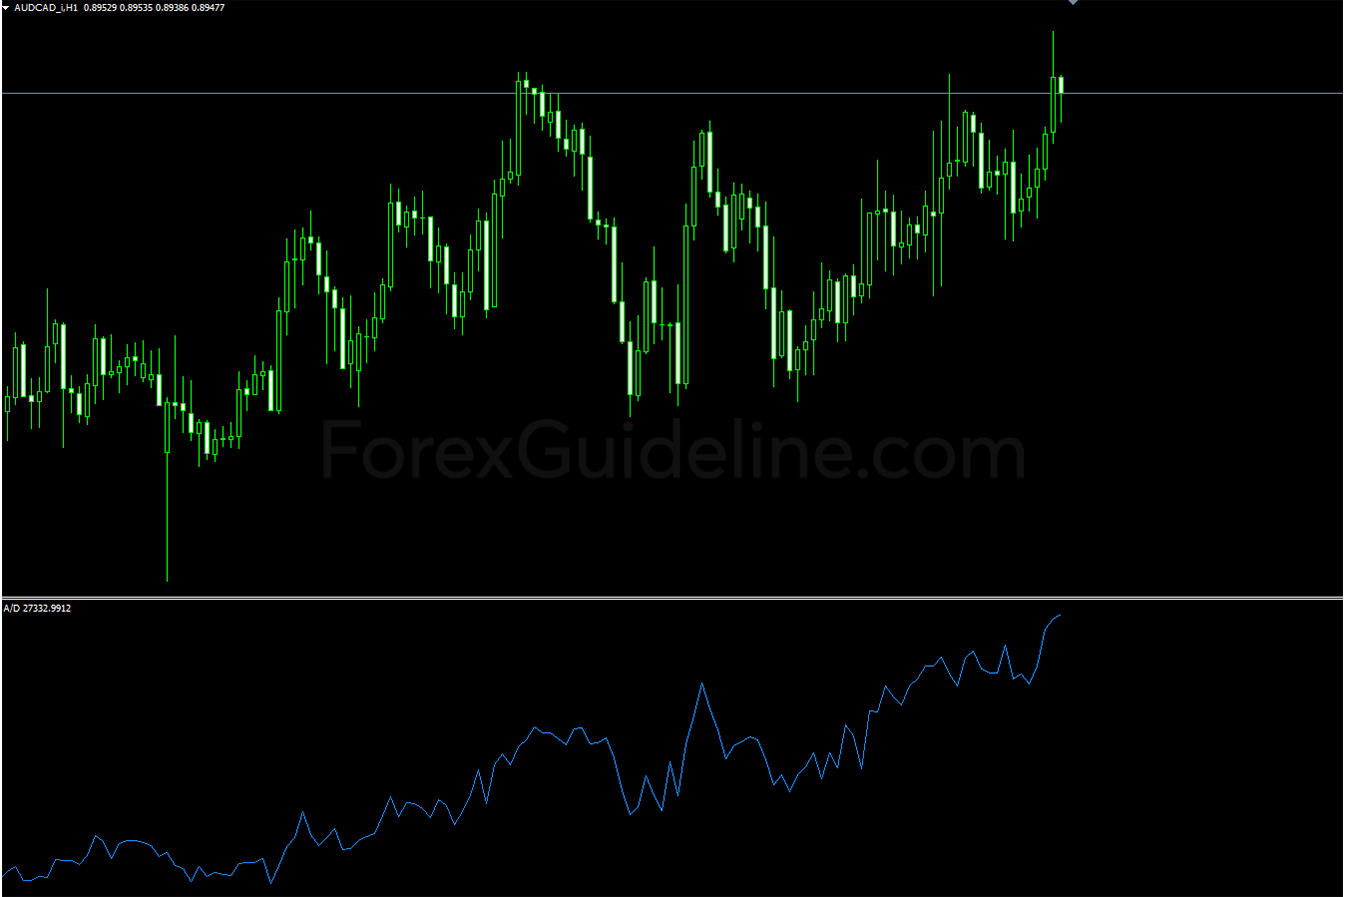
Accumulation/Distribution Indicator (AD) is a cumulative indicator that uses volume and price to assess whether an asset is being accumulated or distributed. The … Read More»
Money Flow Index (MFI) Indicator
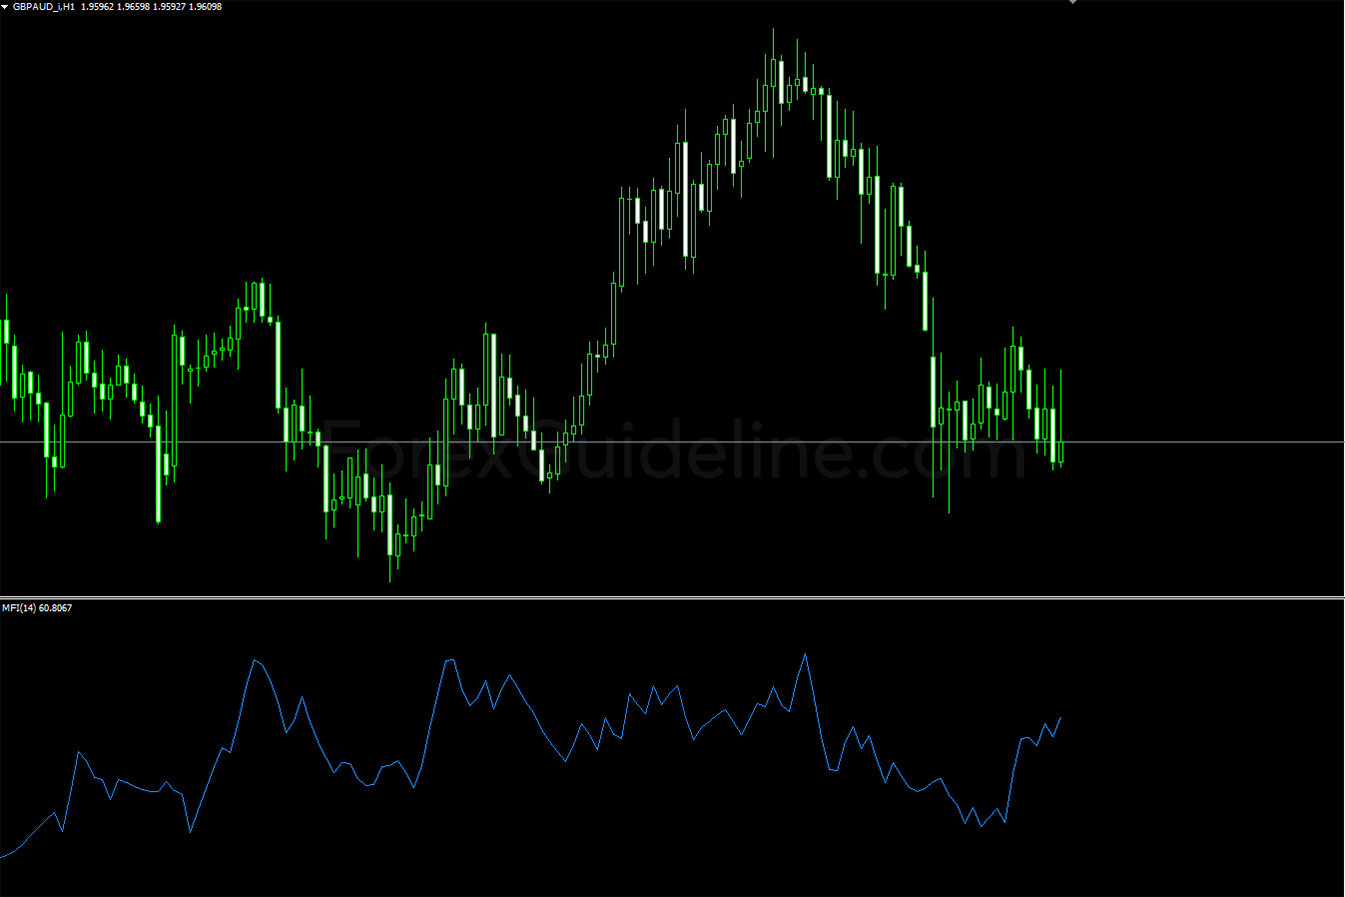
The Money Flow Index (MFI) is an oscillator that uses both price and volume to measure buying and selling pressure. Money flow is … Read More»
On Balance Volume (OBV) Indicator
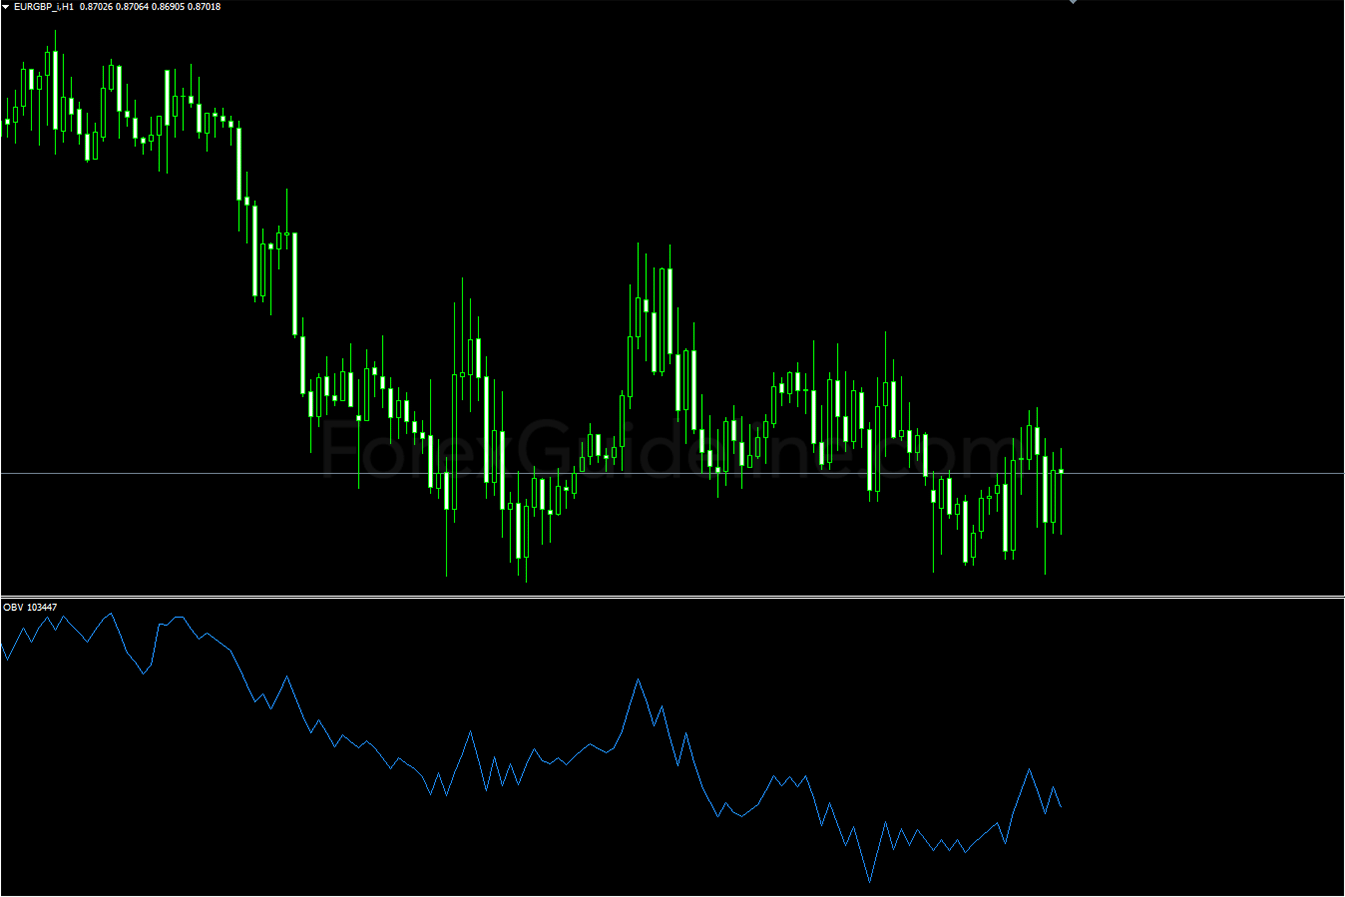
The On Balance Volume (OBV) Indicator is a technical trading momentum indicator that uses volume flow to predict changes in asset price. It … Read More»
Market Facilitation Index Indicator
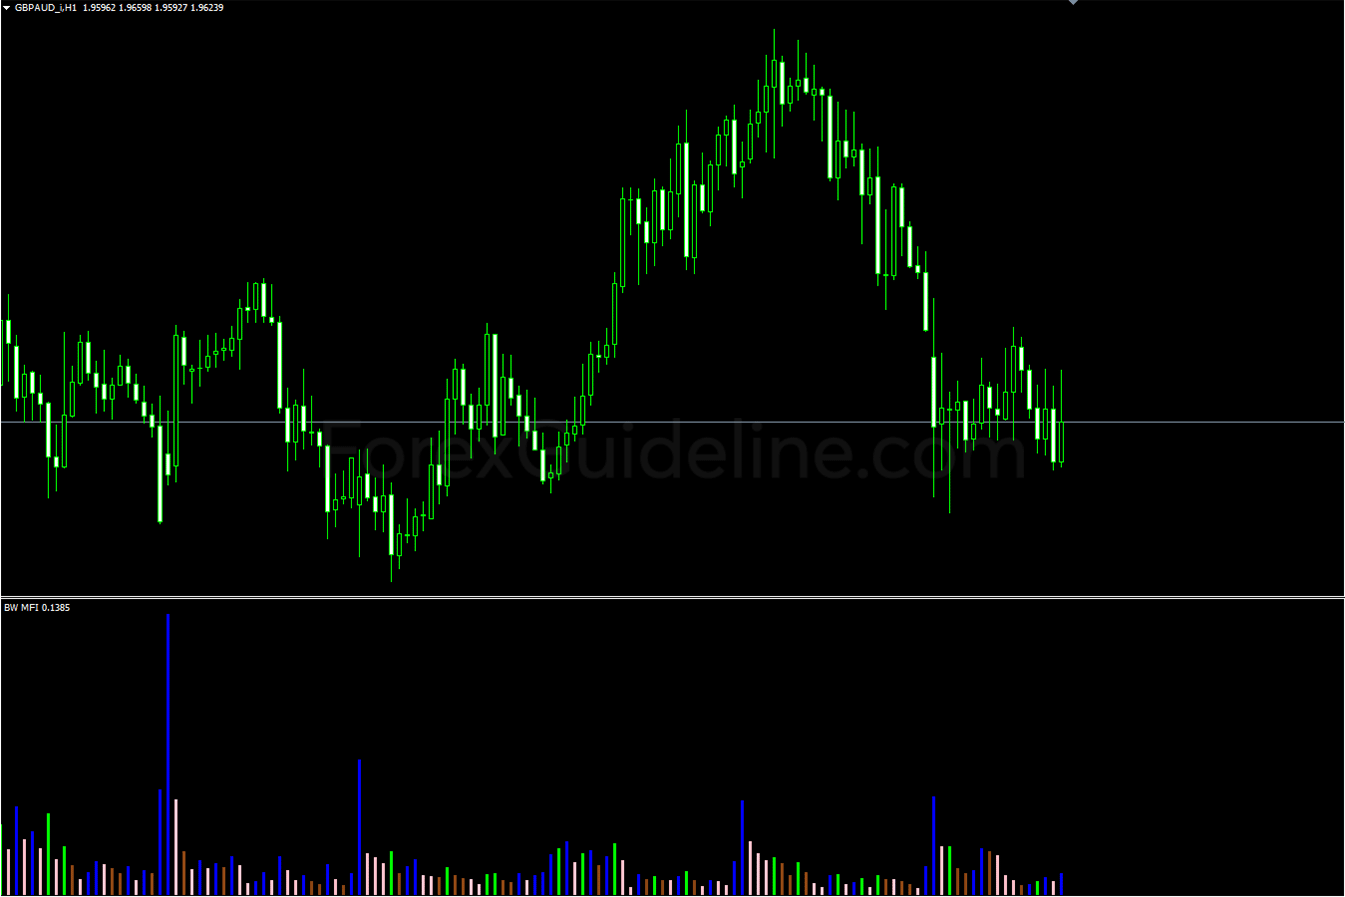
The Market Facilitation Index indicator (MFI) measures the strength/weakness behind the changes in the price of an asset. It can also help you … Read More»
Envelopes Indicator
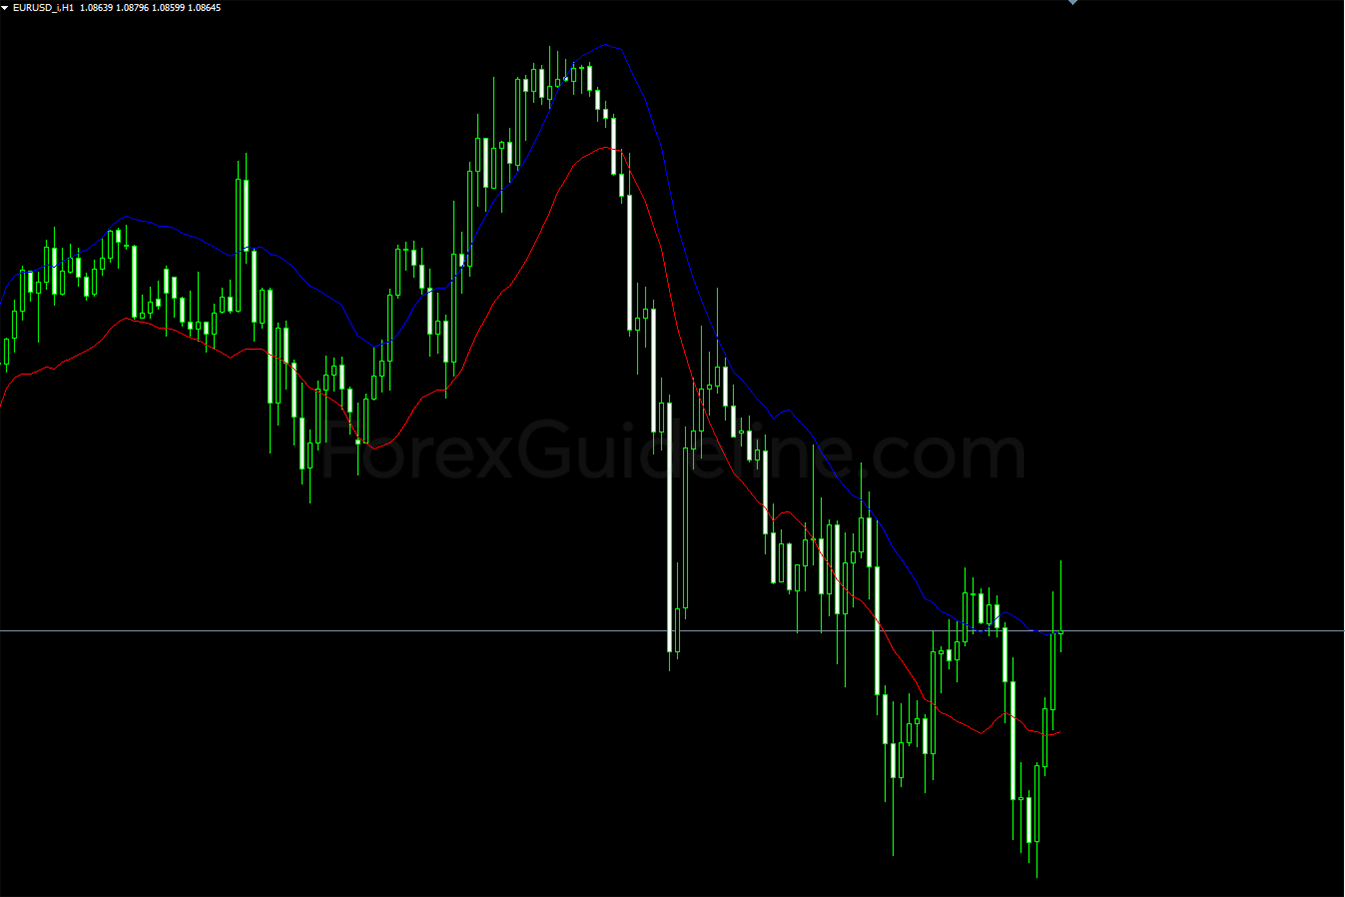
Envelopes Indicator is a technical indicator that show upper and lower bounds. The most common envelope is the moving average envelope, which uses … Read More»
Donchian Channel Indicator
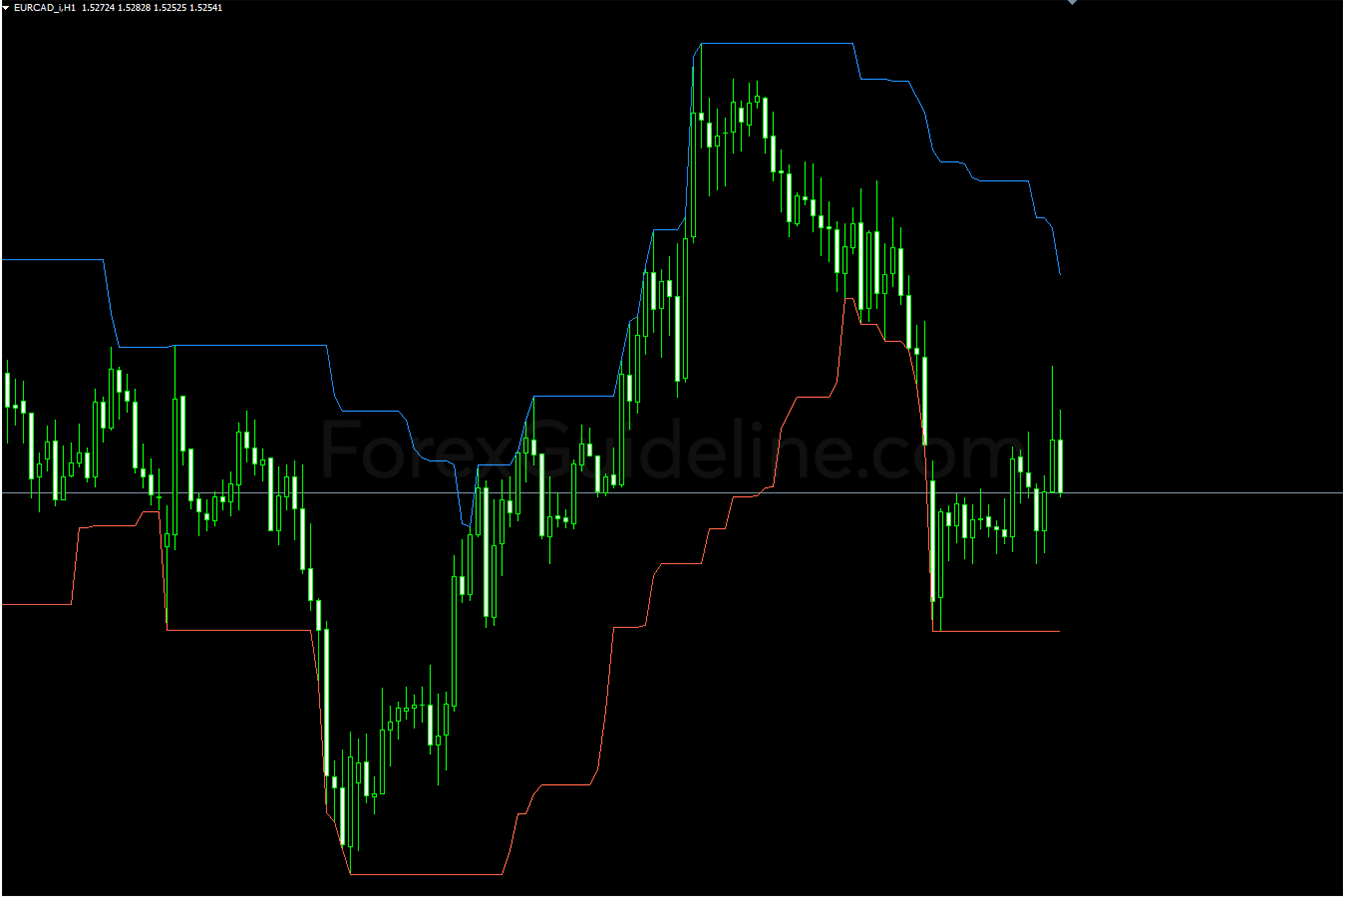
The Donchian Channel indicator draws 3 lines based on moving average calculations formed by upper and lower bands around a mid-range or median … Read More»
Average True Range (ATR) Indicator
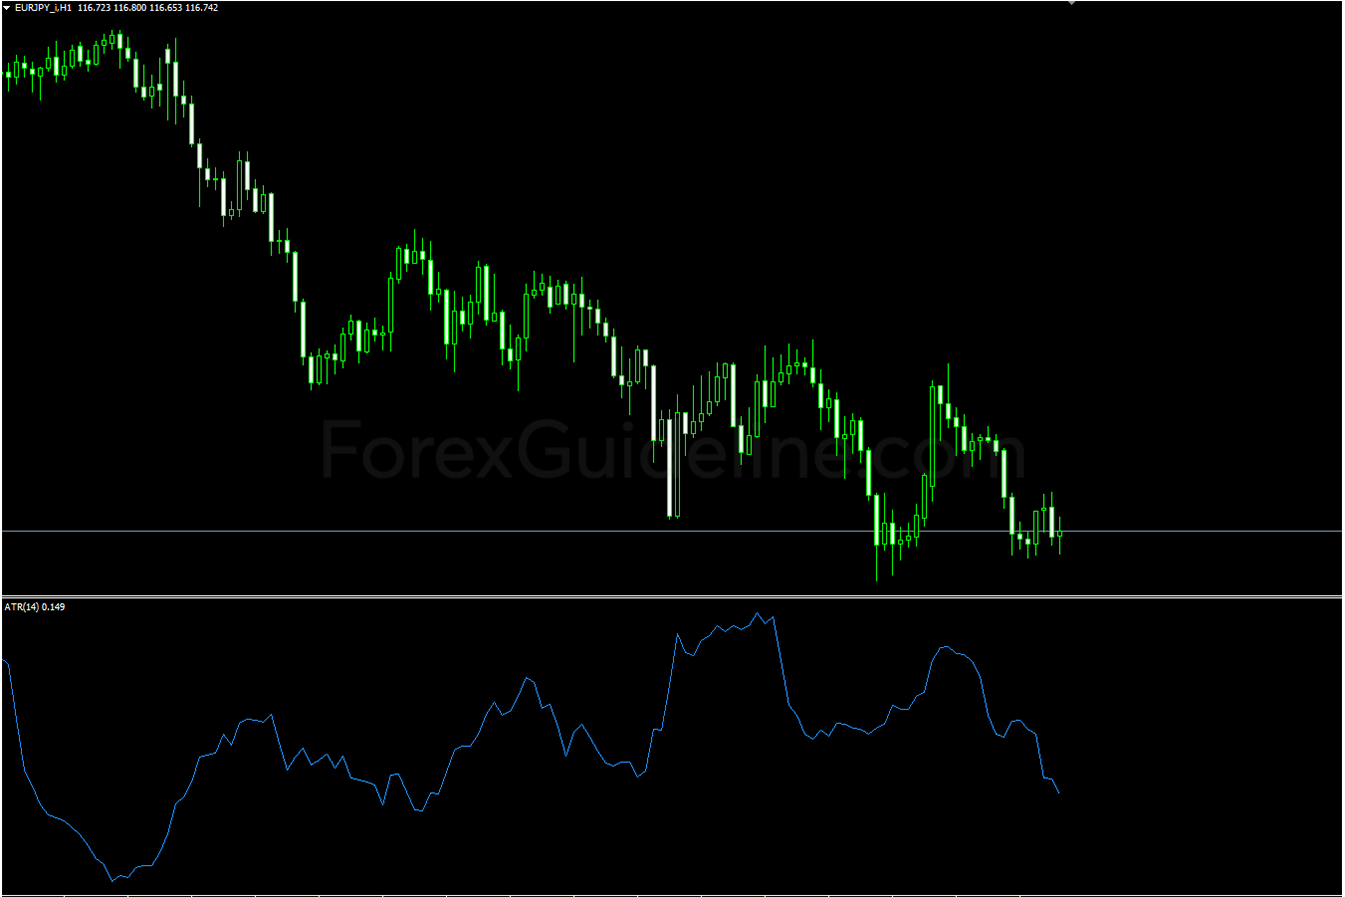
Average True Range (ATR) Indicator is a volatility indicator that shows how much an asset moves, on average, during a given time frame. … Read More»
Bollinger Bands (BB) Indicator
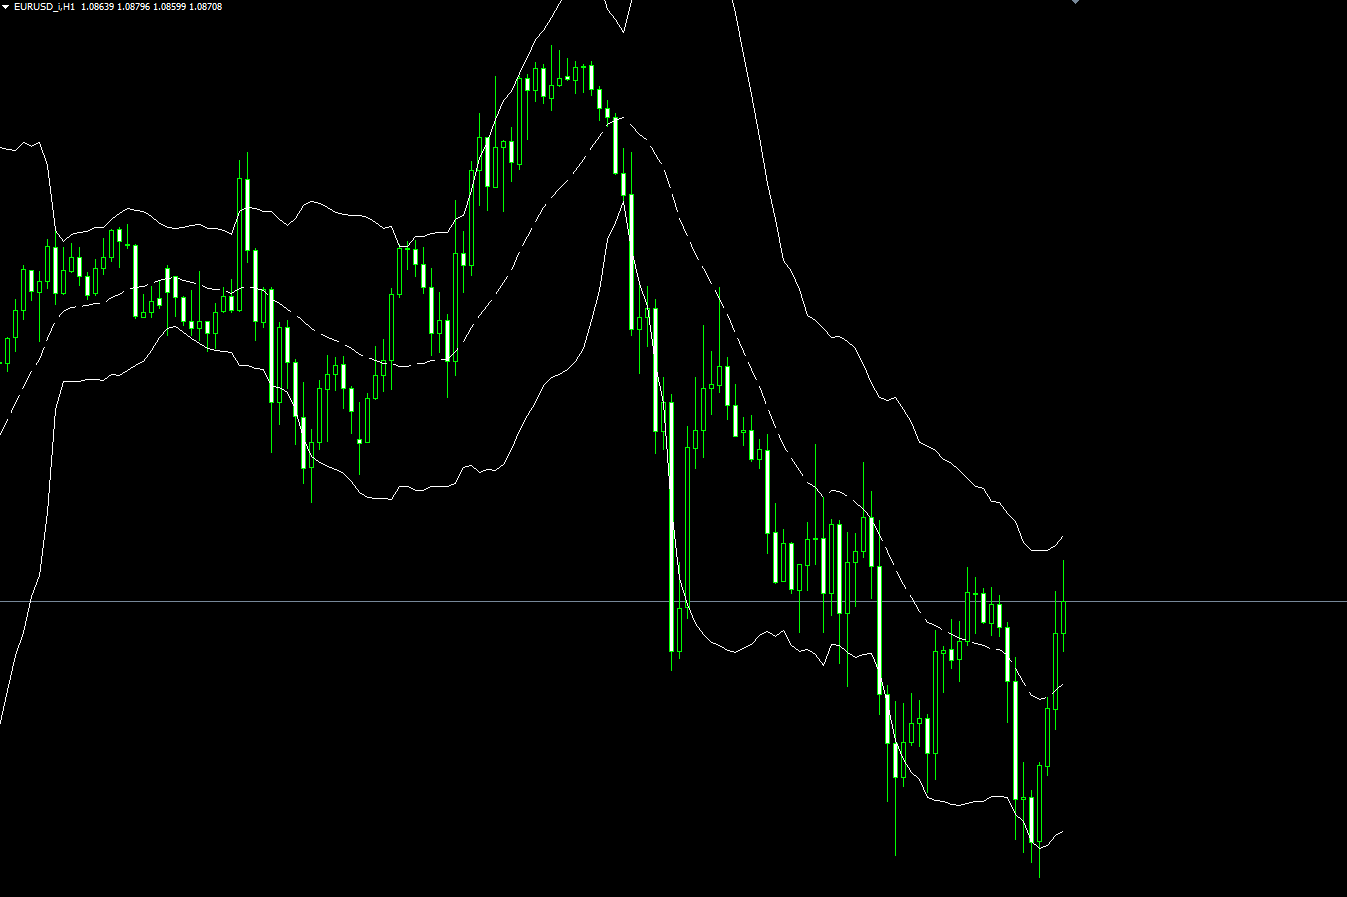
Bollinger Band is a technical indicator that draws 3 lines based on two standard deviations (positively and negatively) away from a 20-day simple … Read More»
Standard Deviation (STDEV) Indicator
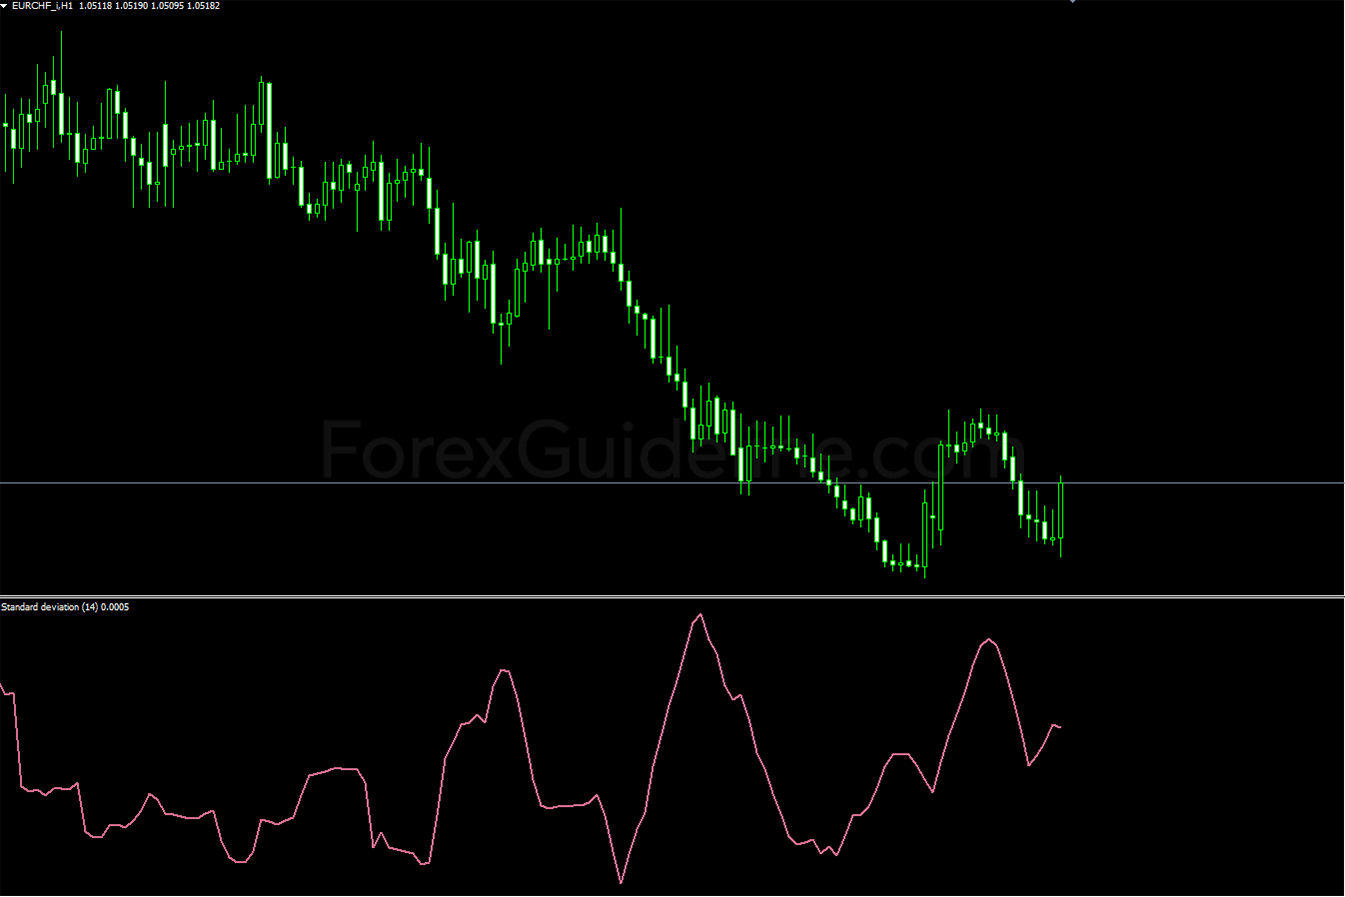
The Standard Deviation Indicator (StdDev) measures market volatility based on the asset price standard deviation value relative to the Moving Average. The higher … Read More»